
Short answer
A solar energy monitoring system carries inverter data over the internet to your phone, showing instantaneous power, daily and monthly production and fault alerts. In Antalya, comparing output with PVGIS expectations is a practical way to notice a drop early; however, the official meter, not the app value, is the basis for net metering and billing.
Key takeaways
- A monitoring app shows instantaneous power, production, string data, battery status and fault logs; content varies by product.
- The measurement used for net metering is the bidirectional hourly meter; the app value may not be exactly the same.
- According to PVGIS, 1 kWp in Antalya city produces about 168 kWh in July and about 99 kWh in December.
- PVGIS monthly deviation is about 2.2 kWh/kWp in July and about 14.6 in January; a summer drop is the more meaningful alarm.
- In rural and mountainous areas, a cellular connection may be needed instead of Wi-Fi.
Solar energy monitoring lets you follow your system's instantaneous power, daily and monthly production and fault alerts from a phone or computer. A monitoring app connected to the internet through the inverter or a separate data logger is the fastest way to notice that production has fallen below expectations. Mobile monitoring is also listed among the services on Solar Nexo's website; which app is used depends on the inverter brand chosen.
What is a solar monitoring system and how does it work?
The system sends the data measured by the inverter to a cloud server through a communication module. This module may use Wi-Fi, Ethernet or a cellular (4G) connection; options vary by product. The data on the server is presented to you through a phone app and a web dashboard. In some systems a current transformer (CT) or an additional meter is added to measure the home's consumption as well.
Monitoring is part of the system, but it is not the measurement used for net metering and billing. Under the regulations, a bidirectional hourly meter at the connection point and a separate control meter measuring production are used (EPDK, Turkey's Energy Market Regulatory Authority, procedures and principles; connection approval letter (çağrı mektubu) example). The figure in the app may not be exactly the same as the official meter reading; if the difference is small and at the expected level, it is not a problem.
What data can you see in a monitoring app?
Monitoring screens generally include the following information. The exact list varies by inverter and platform.
| Data | What it is for | Example alert |
|---|---|---|
| Instantaneous power (kW) | Shows how much the system is producing at that moment | Near-zero power on a sunny day |
| Daily, monthly, yearly production (kWh) | Allows comparison with expected production | Lower production than last year under the same conditions |
| String current and voltage | Shows which panel string is underperforming | One string with lower current than the others |
| Grid import and export | Separates the energy you draw from what you feed in | Unexpected grid import |
| Battery status (state of charge) | Tracks storage in hybrid systems | Low charge or battery fault |
| Fault and event logs | Lists the inverter's error codes | Grid voltage out of range |
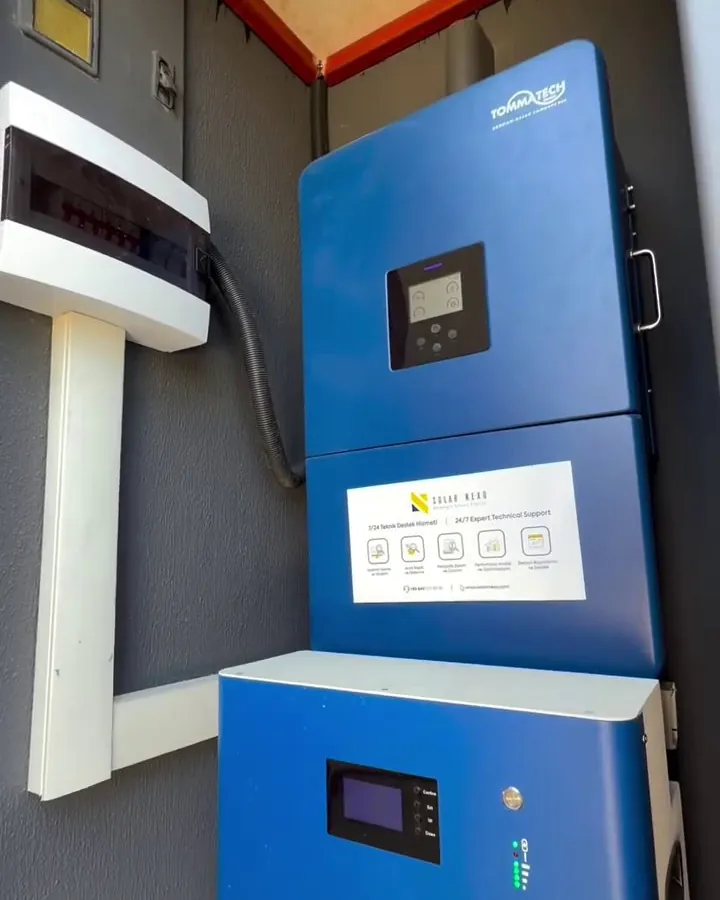
In hybrid systems, battery data matters in particular. Solar Nexo's installation in Manavgat includes 20 TommaTech 605 W panels, a 15 kW hybrid inverter and a 15 kWh LiFePO4 battery. In such a system the monitoring screen shows how the battery fills during the day and how it discharges in the evening.
Comparing production expectations with PVGIS
Monitoring data on its own needs interpretation; it takes on meaning when compared with a reference. According to PVGIS 5.3 data, a 1 kWp south-facing system at the optimum tilt in Antalya city produces about 168 kWh in July and about 99 kWh in December. The daily average in July is about 5.4 kWh/kWp.
For example, for a 12.1 kWp system (20 x 605 W), using the Antalya city PVGIS value, a daily average of about 65 kWh is expected in July (calculated as 5.41 kWh/kWp x 12.1 kWp). This is a value for ideal conditions, with unshaded and clean panels. In reality temperature, cable losses, soiling and cloud cover lower it. Even so, if the monitoring screen keeps showing a figure far below this, the cause should be investigated.
A more systematic method is to calculate specific yield: divide your monthly production (kWh) by your installed capacity (kWp). For example, if a 5.445 kWp system produced 900 kWh in July, the specific yield is about 165 kWh/kWp; this is close to the roughly 168 kWh/kWp PVGIS gives for Antalya city. If you do the same calculation for your own system and note it over a few months, you will see your normal range. When the figure falls clearly below this range, it makes sense to look for the cause. In the comparison, remember the effect of roof orientation and tilt; you can find the details in the article on the solar panel angle and direction.
PVGIS also gives the standard deviation of the monthly values. In July this deviation is about 2.2 kWh/kWp, while in January it is about 14.6 and in December about 13.8 kWh/kWp. In other words, in Antalya the month-to-month difference is small in the summer months; a sustained drop seen in summer is a more meaningful alarm sign than the fluctuation in winter months.
Alarms and alerts: noticing faults early
The real benefit of a monitoring system is that it catches problems early. When grid voltage goes out of range, the inverter stops and the app shows an error code. If one string's current is lower than the others, shading, soiling, a loose connector or a panel fault is suspected. When the internet connection drops, the screen may not update; however, the system keeps running, only the data is not visible.
- Production zero or very low: Check the inverter display, the breakers and the grid status.
- One string low: Look for shading, soiling or a connection fault.
- Recurring error code: Record the code and pass it to technical support.
- Unexpected grid import: Check the production or consumption measurement.
We covered the possible causes of an efficiency drop in the article on the causes of low solar panel efficiency, and inverter faults in the article on inverter faults and solutions. On Solar Nexo's website, maintenance and 24/7 technical support are stated as part of the service process; monitoring data speeds up diagnosis in such interventions.
Practical points for monitoring in Antalya
In Antalya some projects are far from the city center: mountain houses, greenhouse areas, orchard houses and agricultural irrigation systems. In these places the Wi-Fi signal can be weak; a cellular connection or a strong access point is needed. If the rooftop inverter is far from the modem, signal problems can occur. In irrigation systems, monitoring makes it easier to follow the pump's operating hours and daily production; you can find the structure of such a system on our irrigation systems page under our irrigation services. In high-altitude districts such as Elmalı and Korkuteli, winter conditions and connection quality should also be planned for.
Regulations can also affect your monitoring habits. For residential subscribers, net metering is done monthly, while for non-residential facilities that received their connection approval letter (çağrı mektubu) after 12.05.2019, hourly netting applies from 1 May 2026. Rules can change; confirm the current situation with the grid operator. For businesses subject to hourly netting, seeing hourly production and consumption data can guide shifting consumption to sunny hours; this is an interpretation. For detailed information about net metering systems, see our net metering systems page.
Choosing the right monitoring solution
Most modern inverters come with their own monitoring platform; this platform shows the data the inverter produces directly. If you also want to see the home's consumption, a current transformer or an additional meter is needed. For businesses that want to bring several systems onto a single screen, multi-site monitoring options exist. When choosing, look at these: the platform's Turkish-language interface, data retention period, alarm notification method and user permission settings.
Warranty should also be considered. For example, on TommaTech on-grid and hybrid inverters, the standard warranty is 5 years from the invoice date (manufacturer's warranty certificate). Monitoring data makes diagnosis easier by providing historical records when a fault occurs within this period. For this reason, keeping the account and records is helpful in a possible service process. In addition, following the monitoring platform's software updates, making sure notifications are on and keeping your phone number or e-mail address up to date ensure that alerts reach you. Checking these settings together after the system is installed also reduces false alarms in the first months.
Points to watch when using monitoring data
- Set a strong password when installing the app and do not share your account with others.
- Make sure the connection between the inverter and the modem is not cut.
- Compare your monthly data year on year with a reference such as PVGIS; do not decide by looking at a single day's fluctuation.
- If you suspect shading or soiling, check the string data and ask technical support for help if necessary.
- For official billing and net metering, rely on the meter reading.
Conclusion
Solar energy monitoring is a practical tool that shows the health of your investment. Thanks to instantaneous power, production, string data and alarms, problems are noticed early. Interpreting the data against a reference such as PVGIS, and relying on the official meter reading, is the right approach. If you would like to learn about monitoring and maintenance options for your system, you can get in touch with us.
Frequently asked questions
What is a solar energy monitoring app for?
A monitoring app shows the solar system's instantaneous power, daily, monthly and yearly production, fault codes and often battery status. It lets you notice early that production is lower than expected. Which data you see varies by inverter and platform. As long as the system is connected to the internet you can follow the data from anywhere; the official net metering value is still taken from the meter.
Is there a problem if the figure in the monitoring app differs from the electricity meter?
Small differences are expected, because the inverter and the meter measure at different points and with different precision. The value used for net metering is the meter reading. If the difference is large or grows over time, measurement connections, CT placement and meter settings should be checked. In that case, asking technical support for help rather than trying to fix it yourself is right for both safety and warranty.
Do solar panels keep working if the internet goes down?
Yes, a solar system works independently of the internet. When the internet drops, only the monitoring data fails to reach the cloud and the app does not update. Some data loggers can store records in memory and send them when the connection returns; this feature varies by product. When the connection returns, the screen goes back to normal. If no data arrives for a long time, the modem and inverter connection should be checked.
How many kWh should a system produce per day in July in Antalya?
According to PVGIS data, a 1 kWp south-facing system at the optimum tilt in Antalya city produces an average of about 5.4 kWh per day in July. For a 12.1 kWp system this comes to about 65 kWh. This is an ideal reference; shading, temperature, cable losses and soiling can reduce real production.
Can a monitoring system warn of a fault in advance?
It helps you notice some faults early, but it does not warn of every fault in advance. A string's current falling below the others, recurring error codes or an unexpected drop in production can be warning signs. Alarm settings vary by platform. Used together with regular maintenance, monitoring data speeds up diagnosis and reduces unnecessary site visits.
Is battery information visible on the monitoring screen in a hybrid system?
On most hybrid inverter platforms you can see battery state of charge, charge and discharge power and fault status. This lets you follow how the battery fills during the day and how it is used in the evening. The detail shown depends on the product, and some information may only appear with certain battery models; before buying, confirm which information the platform provides.
Is monitoring data used for net metering billing?
No. Net metering and the assessment of surplus energy are based on the official meter data used by the grid operator and the market operator. The monitoring app is for information and performance tracking. For residential subscribers net metering is monthly, and for new non-residential facilities it is hourly from 1 May 2026; rules can change, so the current situation should be confirmed with the grid operator.
Sources
Want a clear calculation for your roof?
The Solar Nexo team carries out a free site survey at your address in Antalya and designs the system that suits your roof, consumption and budget.