

Short answer
According to PVGIS 5.3, Antalya’s solar energy potential is a theoretical 1,656 kWh per year for a 1 kWp system facing south at a 33° tilt. Output peaks in July at 168 kWh/kWp and is lowest in December and January at 99 kWh/kWp. Among districts, Alanya (1,615) and Elmalı (1,719 kWh/kWp) stand out. On that basis, 5 kWp produces about 8,280 kWh and 10 kWp about 16,560 kWh.
Key takeaways
- According to PVGIS 5.3, the theoretical annual yield of a 1 kWp system in central Antalya is 1,656 kWh (south-facing, optimum tilt of 33°, 14% system losses).
- The highest monthly output is in July (168 kWh/kWp) and the lowest in December and January (99 kWh/kWp); the three summer months produce about 1.6 times as much as the three winter months.
- Among the districts listed, Elmalı has the highest value at 1,719 and Alanya the lowest at 1,615 kWh/kWp — a difference of about 6%.
- In theory, 5 kWp produces about 8,280 kWh and 10 kWp about 16,560 kWh per year; shading, soiling and deviation from due south reduce this figure.
- Salt and humidity on the coast, and snow and wind inland, should be taken into account when choosing panels and mounting.
“Is Antalya really a good place for solar panels?” is a question that can be answered with measurable data rather than guesswork. In this article we look at the solar energy potential of Antalya using values from PVGIS 5.3, the tool run by the European Commission’s Joint Research Centre: the annual total, the monthly distribution, differences between districts, the effect of heat and salt, and sample calculations for 5 and 10 kWp systems. All figures are theoretical and exclude shading, soiling and deviation from due south.
Antalya solar energy potential in numbers: what does 1,656 kWh/kWp mean?
PVGIS is a free, publicly available tool that uses satellite-based irradiance data to calculate the expected output of a solar energy system at a given location. For central Antalya, a 1 kWp system facing due south, installed at the optimum tilt (33°) and with 14% system losses assumed, yields 1,656 kWh per year.
This value is expressed in “kWh/kWp” and is a yield indicator independent of system size. In other words, it tells you how much electricity can be generated per year for every 1 kWp of panel capacity. To find the theoretical annual output of any system, simply multiply its installed capacity (kWp) by this value.
The 14% system loss assumption covers cable losses, inverter conversion losses and similar general losses. PVGIS also models the effect of temperature and low irradiance on panel performance. That is why 1,656 kWh/kWp is not a raw irradiance value but the theoretical electrical output of a system.
Month by month: the winter–summer difference in Antalya
The annual total matters, but since you read your electricity bill monthly, the monthly distribution is at least as important. Below are the monthly values PVGIS gives for central Antalya and what they mean for 5 kWp and 10 kWp systems.
| Month | kWh/kWp | 5 kWp (kWh) | 10 kWp (kWh) |
|---|---|---|---|
| January | 99 | 495 | 990 |
| February | 108 | 540 | 1,080 |
| March | 142 | 710 | 1,420 |
| April | 150 | 750 | 1,500 |
| May | 157 | 785 | 1,570 |
| June | 159 | 795 | 1,590 |
| July | 168 | 840 | 1,680 |
| August | 167 | 835 | 1,670 |
| September | 155 | 775 | 1,550 |
| October | 137 | 685 | 1,370 |
| November | 114 | 570 | 1,140 |
| December | 99 | 495 | 990 |
Because of rounding, the monthly values add up to 1,655; the annual value is reported as 1,656 kWh/kWp. The table highlights three key points. First, July peaks at 168 kWh/kWp, while December and January are the weakest months at 99 kWh/kWp. The peak month produces about 1.7 times as much as the weakest month.
Second, the June–August period accounts for 494 kWh/kWp in total, roughly 30% of annual output, while December–February contributes 306 kWh/kWp, roughly 18%. Third, output never drops to zero, even in winter; in Antalya, December production is more than half of the summer peak. We examine winter performance in detail in our article on solar panel performance in the winter months.
This distribution directly shapes system design. Because air-conditioning demand rises in summer, the summer peak coincides with consumption. For net metering (mahsuplaşma) systems, the balance between the summer surplus and the winter shortfall is assessed through the process run with the distribution company Akdeniz EDAŞ and according to the rules of the current regulation as of October 2026.
District comparison: where is solar output in Antalya highest?
Antalya is a large province, and the climate changes markedly between the coastal strip and the highland districts beyond the Taurus Mountains. Here are the values calculated with PVGIS 5.3 under the same assumptions (1 kWp, south-facing, optimum tilt, 14% losses):
| District | kWh/kWp/year | 5 kWp (kWh/year) | 10 kWp (kWh/year) |
|---|---|---|---|
| Elmalı | 1,719 | 8,595 | 17,190 |
| Kaş | 1,664 | 8,320 | 16,640 |
| Central Antalya | 1,656 | 8,280 | 16,560 |
| Korkuteli | 1,655 | 8,275 | 16,550 |
| Manavgat | 1,649 | 8,245 | 16,490 |
| Alanya | 1,615 | 8,075 | 16,150 |
Among the districts listed, the highest value is in Elmalı and the lowest in Alanya, a difference of about 6%. Elmalı is a cooler, high-altitude plateau district, which lets panels operate at lower temperatures; this is one possible reason for the difference. Kaş, central Antalya, Korkuteli and Manavgat show very similar values.
In practice, this difference matters less than the orientation and shading of your roof. A shaded, east-facing roof in the same district can produce far less than an unshaded, south-facing one. For a detailed assessment by district, take a look at our district guide to solar energy in Antalya.
Temperature coefficient and the efficiency of solar panels in Antalya
Solar panels love light but dislike heat. As the cell temperature rises, output power falls; the rate of this loss is given by the “temperature coefficient” on the datasheet. It is stated as a negative percentage, and the closer it is to zero, the less power the panel loses in the heat.
During an Antalya summer, roof surfaces and panel cells can get considerably hotter than the surrounding air. That is why panels with a low temperature coefficient are preferred in hot climates. N-Type TOPCon cell technology is one of the options that stands out here; you can find the details of the technology in our article what is a TOPCon panel.
Mounting is also part of temperature management. A structure that allows air to circulate behind the panel helps keep the cells cooler. July may be the month with the highest total output, but that is down to long, clear days; under the same irradiance, a panel works more efficiently on a cool spring day.
Humidity, salt and dust by the sea
For solar panels in Antalya’s coastal districts, two environmental factors stand out: salty air and humidity. Salt can form a thin film on the panel glass that reduces light transmission and, over time, cause corrosion of metal fasteners. Humidity can make this build-up sticky.
For coastal projects, corrosion-resistant mounting materials, suitable fasteners and panels that have passed salt mist resistance tests should therefore be preferred. Pollen in spring and dust at the end of summer can also collect on the glass. Regular visual checks and cleaning when needed help bring real-world output closer to the theoretical potential.
Inland, conditions are different. In highland districts such as Elmalı and Korkuteli, snow load and wind are factors that must be taken into account in the structural calculation. Once snow slides off the panels, production quickly recovers, but the mounting system has to be chosen to carry that load.
The optimum tilt of 33° and why orientation matters
According to PVGIS, 33° is the tilt that maximises annual output for central Antalya. This angle balances the annual total between the high summer sun and the low winter sun. Tiled roofs are often close to this pitch; on flat concrete roofs, the desired angle can be achieved with a mounting structure.
Orientation is just as important as tilt. A south-facing surface is the reference for theoretical output; east- and west-facing surfaces deliver lower but often still worthwhile production. To assess the angle and orientation of your own roof, read our guide to solar panel angle and orientation in Antalya.
Sample calculation: what do 5 and 10 kWp systems produce per year in Antalya?
The calculation is simple: installed capacity × the annual PVGIS value. For central Antalya:
- 5 kWp: 5 × 1,656 = approximately 8,280 kWh per year (theoretical). That corresponds to an average of 690 kWh per month, although the actual distribution ranges from about 495 kWh in January to about 840 kWh in July.
- 10 kWp: 10 × 1,656 = approximately 16,560 kWh per year (theoretical). Monthly values range from about 990 kWh in December to about 1,680 kWh in July.
Install the same systems in Elmalı and the theoretical output rises to 8,595 kWh for 5 kWp and 17,190 kWh for 10 kWp; in Alanya it comes to 8,075 and 16,150 kWh respectively. These values assume a due-south orientation, optimum tilt and an unshaded surface. Real-world output may fall below them depending on roof orientation, pitch, shading, soiling and the equipment used, which is why a yield estimate from any solar company in Antalya should state its assumptions.
To see the right system size for your own consumption, you can use our solar energy calculator, and for real production examples, read our article on how much electricity solar panels produce in Antalya.
Turning Antalya’s solar energy potential into real output
Theoretical potential is a starting point; what turns it into real output is sound design. During the site survey, the solar company in Antalya you work with should measure the orientation and pitch of the roof and its shading throughout the day; then your consumption profile is derived from your bills and the system is sized on the basis of this data.
For sunshine-duration data, the station records published by the Turkish State Meteorological Service (MGM) are also a useful reference. When the satellite-based yield calculation of PVGIS is considered together with the meteorological observations of MGM, a more complete picture of the solar energy potential in Antalya emerges.
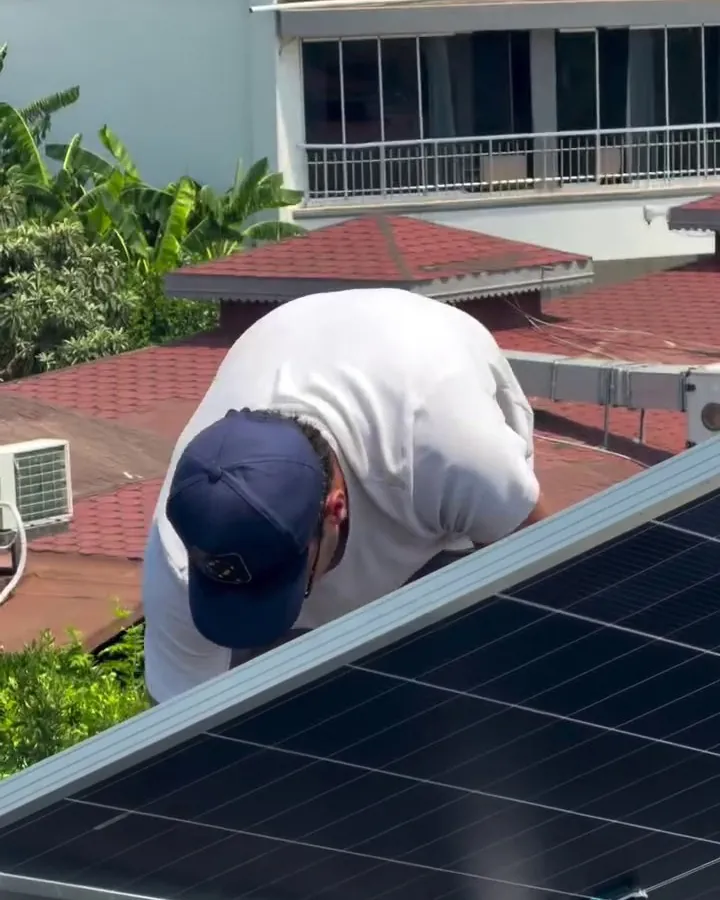
At Solar Nexo, we carry out free site surveys in Antalya and the surrounding area and base the yield estimates in our quotes on verifiable sources such as PVGIS. As a solar installer and authorised dealer of TommaTech and CW Enerji, we use original, invoiced products from these brands in our installations, including their TOPCon N-Type panels.
Conclusion
The solar energy potential of Antalya rests on solid data: a theoretical 1,656 kWh per kWp per year in the city centre, values ranging from 1,615 to 1,719 kWh across the districts, and monthly output that never drops to zero, even in winter. How much of this potential you capture with an investment in Antalya solar energy depends on the orientation of your roof, its shading and the right choice of equipment.
Request a free site survey to find out the real potential of your roof. You can reach the Solar Nexo team on +90 540 007 63 96 or at info@solarnexo.com.
Frequently asked questions
How much electricity does 1 kWp of solar panels produce per year in Antalya?
According to PVGIS 5.3 data, a 1 kWp system in central Antalya facing south at a 33° tilt, with 14% system losses assumed, produces a theoretical 1,656 kWh per year. This value does not include shading, soiling or deviation from due south; real-world output may be lower depending on roof conditions.
In which month do solar panels produce the most in Antalya?
According to PVGIS data, output is highest in July: about 168 kWh per kWp. August follows with 167 and June with 159 kWh/kWp. The lowest output is in December and January, at about 99 kWh per kWp. Even so, production never drops to zero during the winter months.
Which district of Antalya has the highest solar output?
In values calculated with PVGIS 5.3 under the same assumptions, Elmalı has the highest value among the districts listed at 1,719 kWh/kWp and Alanya the lowest at 1,615 kWh/kWp. Kaş comes in at 1,664, the city centre at 1,656, Korkuteli at 1,655 and Manavgat at 1,649 kWh/kWp. However, roof orientation and shading can matter more than the district.
How much does a 5 kWp solar system produce per year in Antalya?
For central Antalya, the theoretical calculation is 5 × 1,656 = approximately 8,280 kWh per year. Month by month, this output ranges from about 495 kWh in January to about 840 kWh in July. For a 10 kWp system, the theoretical annual output is about 16,560 kWh. The real value varies with roof conditions.
What is the best tilt angle for solar panels in Antalya?
According to PVGIS, the optimum tilt that maximises annual output in central Antalya is 33°, with panels facing south taken as the reference. Tiled roofs are often close to this value; on flat roofs, the angle can be set with a mounting structure. East- or west-facing roofs deliver lower but often still worthwhile output.
Does the summer heat in Antalya reduce panel efficiency?
Yes, output power falls somewhat as the cell temperature rises; the rate of this loss is shown by the temperature coefficient on the datasheet. PVGIS calculations include the effect of temperature in the model. Panels with a low temperature coefficient and mounting that allows air to circulate behind them help limit the loss in a hot climate.
Do solar panels cause problems on homes by the sea?
Installed with the right materials, they are suitable for coastal homes too. Salty air can leave deposits on the glass and increases the risk of corrosion on metal fasteners. Corrosion-resistant mounting materials, panels that have passed salt mist tests and regular visual checks are therefore recommended. Cleaning when needed reduces production losses.
Sources
Want a clear calculation for your roof?
The Solar Nexo team carries out a free site survey at your address in Antalya and designs the system that suits your roof, consumption and budget.