Short answer
The first year after solar panel installation in Antalya is the period for confirming that the system works as expected. Handover documents are checked at commissioning, and daily and monthly production is tracked in the monitoring app. According to PVGIS 5.3, 1 kWp in central Antalya theoretically produces 99 kWh in December and 168 kWh in July. A clean after the spring pollen, watching summer efficiency and a full annual check in month twelve are recommended.
Key takeaways
- On commissioning day, the warranty certificates, technical documents and monitoring app access should all be handed over in full.
- On the monitoring screen, instantaneous power (kW) and daily energy (kWh) are different things; production should be compared with days in the same month.
- According to PVGIS 5.3, the theoretical monthly output of 1 kWp in central Antalya is 99 kWh in December and January and 168 kWh in July; a 10 kWp system theoretically produces about 16,560 kWh a year.
- Check the surface after the spring pollen season and the dry summer months, and clean with non-abrasive methods during cool hours.
- In month twelve, an annual check covering connections, earthing, surge protection and inverter logs should be done; keep warranty certificates and invoices safe.
The day the panels are fixed to the roof and the inverter starts up for the first time is really the start of the journey. The first 12 months after solar panel installation in Antalya are a critical period: this is when you see whether the system produces as calculated, learn to read the monitoring screen and experience the effect of the seasons on production for the first time. The habits you build in this period directly affect the system's performance in the years ahead.
This guide walks through the first year step by step: commissioning and handover, the monitoring app, expected monthly production based on PVGIS data, reading a net-metered bill, the first clean, efficiency in the summer heat, the annual check and keeping your warranty documents. At the end of the article you will also find a month-by-month checklist you can follow.
Day one: commissioning and handover
When the installation team switches the system on, checking whether "the inverter lights are on" is not enough. During handover, we recommend going through the following points together:
- Handover documents: manufacturer warranty certificates, datasheets and product invoices for the panels, the inverter and any battery should be handed over in full.
- Serial numbers: make sure the serial numbers in the documents match the products on site; this information is requested for warranty claims.
- Monitoring access: check that the monitoring app is installed on your phone and that you can log in with your own account.
- Outage test: on hybrid or off-grid systems, try the switchover of critical loads to the battery once, with the team present.
- Emergency information: learn how to shut the system down safely and which switch controls what.
For net-metered systems, one detail is worth knowing: the contractual delivery time for Solar Nexo installations is 14 working days, but the official application process takes an additional 8–12 months on average. Exporting energy to the grid and net metering begin only after Akdeniz EDAŞ (AEDAŞ, the local distribution company) has completed the connection procedures. Your first-year calendar may therefore shift depending on your connection date.
Learning to read the monitoring app
The monitoring app is where you keep a finger on your system's pulse. Learning to interpret the key values on the screen in the first few weeks helps you spot any problem early later on.
Instantaneous power (kW) shows what the system is producing at that very second and changes constantly throughout the day. Daily energy (kWh) is the total produced over the day, and this is the value you really need to follow. On a clear day, the production curve forms a bell shape: it rises in the morning, peaks around midday and tapers off towards evening. On cloudy days the curve is jagged, and that is completely normal.
When assessing production, compare days with similar weather in the same month, not different seasons. If you see output drop noticeably on a clear day, a recurring fault code on the screen or a string producing nothing, you need technical support. On hybrid systems, the battery state of charge and the energy imported from and exported to the grid are shown on the same screen. For details, take a look at our article on solar monitoring systems.
Expected monthly production after solar panel installation in Antalya
The most common question in the first year is "how much should I have produced this month?" PVGIS 5.3 data is a good reference for this. The table below shows the theoretical monthly output in central Antalya for a system facing south at the optimum tilt (33°) with 14% system losses assumed. For your own system, simply multiply the value by your installed capacity (kWp).
| Month | 1 kWp (kWh) | 5 kWp (kWh) | 10 kWp (kWh) |
|---|---|---|---|
| January | 99 | 495 | 990 |
| February | 108 | 540 | 1,080 |
| March | 142 | 710 | 1,420 |
| April | 150 | 750 | 1,500 |
| May | 157 | 785 | 1,570 |
| June | 159 | 795 | 1,590 |
| July | 168 | 840 | 1,680 |
| August | 167 | 835 | 1,670 |
| September | 155 | 775 | 1,550 |
| October | 137 | 685 | 1,370 |
| November | 114 | 570 | 1,140 |
| December | 99 | 495 | 990 |
| Annual | 1,656 | 8,280 | 16,560 |
Because of rounding, the sum of the monthly values may differ from the annual figure by 1 kWh. These numbers are theoretical; your roof's orientation, tilt, shading and soiling change real production. Seeing lower values than the table on an east-west or low-tilt roof does not mean something is wrong. What matters is that your own system shows a consistent month-by-month trend.
Values vary slightly between districts: according to PVGIS 5.3, the theoretical annual yield is 1,615 kWh/kWp in Alanya, 1,649 in Manavgat, 1,664 in Kaş, 1,655 in Korkuteli and 1,719 in Elmalı. For an estimate specific to your roof, use our solar energy calculator.
Reading your net-metered bill
The first bills after switching to a net-metered system look different from what you are used to. The bill shows energy imported from the grid and energy exported to the grid as separate items, and the two are netted against each other under the net metering rules. Which period the netting covers and how it is calculated is set by the current regulations as of October 2026, while tariffs are set by EPDK (Turkey's energy market regulator).
When reading your bill, look at the meter reading dates, the amounts of energy imported and exported, and the amount billed after netting. Compare these values with the data in your monitoring app for the same date range. Do not expect them to match exactly: the monitoring system measures total production, while the meter only measures what is exchanged with the grid. Energy you use in the home at the moment it is produced never shows up on the meter at all.
If you see a clear, unexplained difference, keep the bill and screenshots from the monitoring app and ask for support. For the basics, see our article what is a net-metered system.
The first clean and the spring pollen season
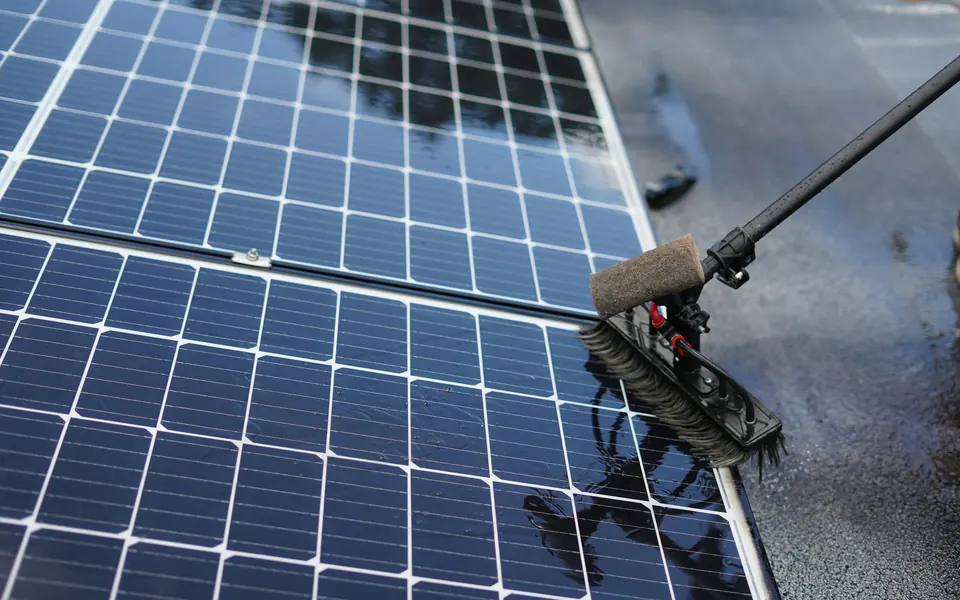
In Antalya solar energy systems, the rainy months partly wash the panel surface, but dust builds up in dry periods. In spring, pollen can leave a thin film on solar panels in Antalya, especially near pine forests and citrus groves. On roofs close to the sea, salt deposits need extra attention, as do soot and dust near industrial zones and roadsides.
Time the first clean by observation, not by the calendar. When you notice that output on clear days has slipped compared with similar days and there is a visible film on the surface, it is time to clean. Follow these rules when cleaning:
- Do not use abrasive sponges, stiff brushes or chemical detergents.
- Do not aim a pressure washer directly at the panels or junction boxes.
- Rather than pouring cold water on hot panels, choose the cool hours of early morning or evening.
- Do not put your safety at risk on the roof; get professional help for roofs that are hard to access.
We explain the effect of pollen and dust on production in detail in our article on dust, pollen and solar panels.
Efficiency in the summer heat: July and August for solar energy in Antalya
According to PVGIS, July and August are the months of peak production in Antalya. Even so, you should not be surprised to see instantaneous power at midday stay noticeably below the panel's rated value during these months. As a panel heats up, its power falls; the rate of that drop is expressed by the temperature coefficient on the panel's datasheet. Because long sunshine hours more than make up for this loss, total production in the summer months is still high.
There are two things to watch in summer. The first is the inverter: overheated inverters may reduce power to protect themselves. It is important that the inverter is in a well-ventilated spot out of direct sun and that its fan or cooling fins are not clogged with dust. The second is ventilation under the panels; the gap left during mounting helps the panels cool, so check that it has not filled with leaves or debris. These simple precautions are the most practical way to protect the summer performance of solar energy in Antalya.
A 12-month checklist for Antalya
The checklist below splits the first-year checks after a solar panel installation in Antalya into periods. You can adapt it to your own installation date. Most of it you can do yourself; only the annual check needs a solar installer.
| Period | What to do |
|---|---|
| Installation day | Receive the documents, match the serial numbers, test monitoring access |
| First week | Note daily production, observe the bell curve on clear days |
| First month | Compare the monthly total with the PVGIS table, check for fault codes |
| March–May | Inspect the surface after the pollen season, clean if needed |
| June–August | Watch inverter ventilation and power drops at midday |
| September–November | Check for dust after the dry season, observe the change in production after the first rains |
| December–February | Follow winter production, look over the mounting and cables after storms and downpours |
| Month 12 | Have the annual check done, record total first-year production |
The first annual check and keeping your warranty documents
The comprehensive check at the end of month twelve is the review of your first year. It covers the tightness of DC and AC connections, the MC4 connectors, cable insulation and routing, earthing and surge protection devices, mounting system bolts, the panel surfaces and frames, and the inverter's fault log. Where needed, a thermal camera scan for hot spots at cell level is carried out. Solar Nexo also offers its solar plant maintenance and repair service for systems installed by other solar companies in Antalya.
Keeping documents is part of maintenance too. The panels carry a 30-year performance warranty; the product and material warranty varies by model and is stated in the warranty certificate. Inverters carry a 2-, 3- or 5-year factory warranty depending on power rating and model. Lithium batteries carry a warranty of 5 years / 8,000 cycles. Keep the warranty certificates, product invoices, serial number list and installation photos in both printed and digital form. Recording your first-year monthly production figures in a spreadsheet also gives you a valuable reference for comparing the performance of your solar panels in Antalya in the years that follow.
If you run into a problem during the year, you can reach Solar Nexo's 24/7 technical support line by phone or WhatsApp.
Conclusion
The first year after solar panel installation in Antalya is a year of getting to know and verifying your system. Receiving the handover documents in full, reading the monitoring screen correctly, comparing production with the monthly PVGIS values, checking the surface after the pollen and dust seasons and having a comprehensive check done at the end of the year lay the foundation for your Antalya solar energy investment to run smoothly for many years. Owners of solar panels in Antalya who follow this routine catch small issues before they cost production.
If you are not sure your system is producing as expected, or you want to schedule your first annual check, contact the Solar Nexo team. For those considering a new installation, we offer free site surveys in Antalya and the surrounding area; to book, call +90 540 007 63 96 or reach us through our contact page. A solar installer that knows your roof can tell you quickly whether a dip in output is weather or a fault.
Frequently asked questions
How much electricity does a solar panel system produce in its first year?
First-year production depends on installed capacity and roof conditions. According to PVGIS 5.3 data, a 1 kWp system in central Antalya at the optimum tilt facing south theoretically produces 1,656 kWh a year. On that basis, about 8,280 kWh of theoretical output can be expected for 5 kWp and about 16,560 kWh for 10 kWp. Shading, orientation, tilt and soiling make real production differ from this value; you should follow your own system's trend in the monitoring app.
When should I clean the panels after installation?
Cleaning should be timed by observation, not by the calendar. When you notice that output on clear days has slipped compared with similar days and there is a visible film of dust or pollen on the panels, it is time to clean. In Antalya, the spring pollen season and the end of the dry summer months are usually good times to check. Do not use abrasive materials or pressurised water, and choose the cool hours of the day.
What should I do if production looks low in the monitoring app?
First make sure you are comparing correctly: compare production with days of similar weather in the same month, not with other seasons. Low output on cloudy days is normal. If output is clearly low on a clear day, a fault code keeps recurring on the screen or a string is producing nothing, save screenshots and ask for technical support. You can reach Solar Nexo's technical support line 24/7 by phone or WhatsApp.
Why does solar panel efficiency drop in summer?
As a panel heats up, its electrical power falls; the rate of that drop is expressed by the temperature coefficient on the panel's datasheet. That is why, in Antalya, instantaneous power at midday in July and August can stay below the rated value. However, long sunshine hours make up for this loss, and according to PVGIS these are the highest-production months of the year. Keeping the inverter in a shaded, well-ventilated spot protects summer performance.
Why do the figures on my net-metered bill differ from the monitoring app?
Because the two measure different things. The monitoring app shows the system's total production, while the meter only measures the energy imported from and exported to the grid. Energy consumed in the home at the moment it is produced never shows up on the meter. So the two values are not expected to match exactly. Compare them for the same date range; if you see a large, unexplained difference, keep the bill and screenshots and ask for support.
What does the first annual check involve?
The first annual check examines the tightness of DC and AC connections, the MC4 connectors, cable insulation, earthing and surge protection devices, mounting system fixings, the panel surfaces and frames, and the inverter's fault log. Where needed, a thermal camera scan for hot spots is carried out. Total first-year production is also recorded and compared with expectations. Solar Nexo offers this service for systems installed by other companies as well.
Which warranty documents should I keep?
You should keep the manufacturer warranty certificates for the panels, the inverter and any battery, together with the product invoices and the serial number list. On Solar Nexo installations, panels carry a 30-year performance warranty, inverters a 2-, 3- or 5-year factory warranty depending on power rating and model, and lithium batteries a warranty of 5 years / 8,000 cycles. Keeping both printed and digital copies of the documents speeds up any warranty claim.
Sources
Want a clear calculation for your roof?
The Solar Nexo team carries out a free site survey at your address in Antalya and designs the system that suits your roof, consumption and budget.